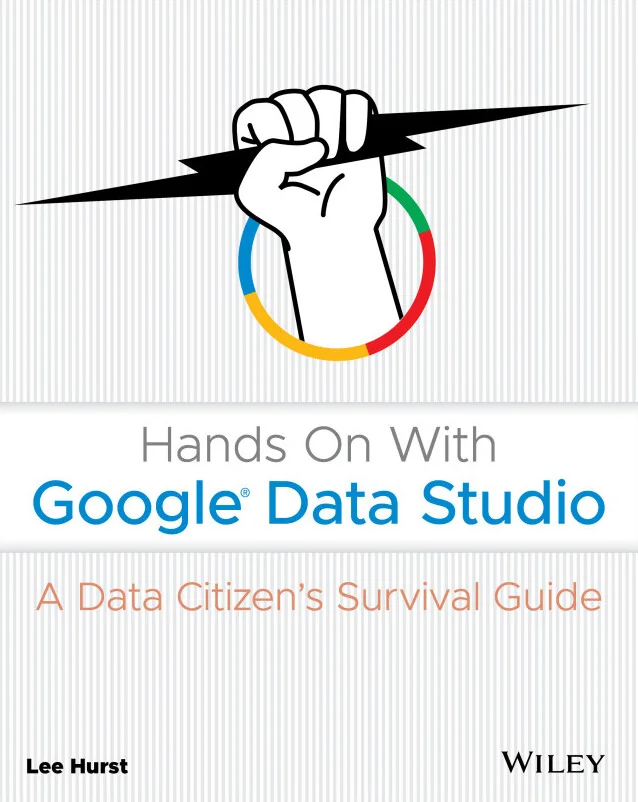
Hands On With Google Data Studio
A Data Citizen's Survival Guide
Created by Lee Hurst
Learn how to turn your Google Sheets data into interactive reports and dashboards using Google Data Studio. You'll start from the basics and quickly move to building charts, scorecards, and tables that make your data easy to understand and share.
Wiley | Sep 2026 | 432 min
What You Will Learn
You'll follow a step-by-step process, starting with connecting your data and building your first report. Each section introduces new features like charts, filters, and design tweaks through practical examples. By working hands-on, you'll build confidence and real skills as you go.
Key Features
- Connect Google Sheets data and build clear visual reports from scratch
- Add charts, scorecards, filters, and time-series views for deeper insights
- Refine layouts and share interactive dashboards with your team or stakeholders
Target Audience
This course is perfect for data citizens, spreadsheet users, analysts, managers, and marketers who want to create visual reports with Google Data Studio. No advanced analytics experience is needed-just a Gmail account and a desire to communicate data more clearly.