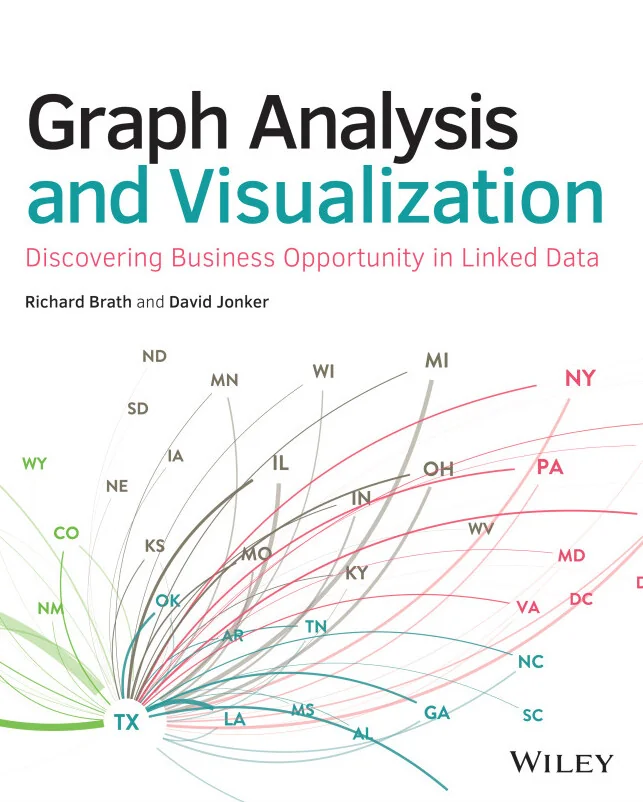
Graph Analysis and Visualization
Discovering Business Opportunity in Linked Data
Created by David Jonker, Richard Brath
Explore how graph analysis can uncover hidden patterns and relationships in connected data. Learn to transform raw information into clear visualizations that highlight business opportunities. Build practical skills to turn complex networks into actionable insights.
Wiley | Sep 2026 | 544 min
What You Will Learn
You will start by understanding why graphs matter and how to prepare your data for analysis. Step by step, you will use visual reasoning, practical tools, and lightweight programming to explore different network structures. Each section builds your ability to spot patterns and communicate findings clearly.
Key Features
- Collect, clean, and connect data to prepare for effective graph analysis
- Create visualizations that reveal patterns, communities, and business flows
- Apply graph techniques to real-world business scenarios for better decision-making
Target Audience
This course is ideal for data analysts, business professionals, marketers, and finance teams with some experience in data analysis. If you want to use graph and network techniques to uncover business opportunities in linked data, you will find practical guidance and hands-on examples to advance your skills.