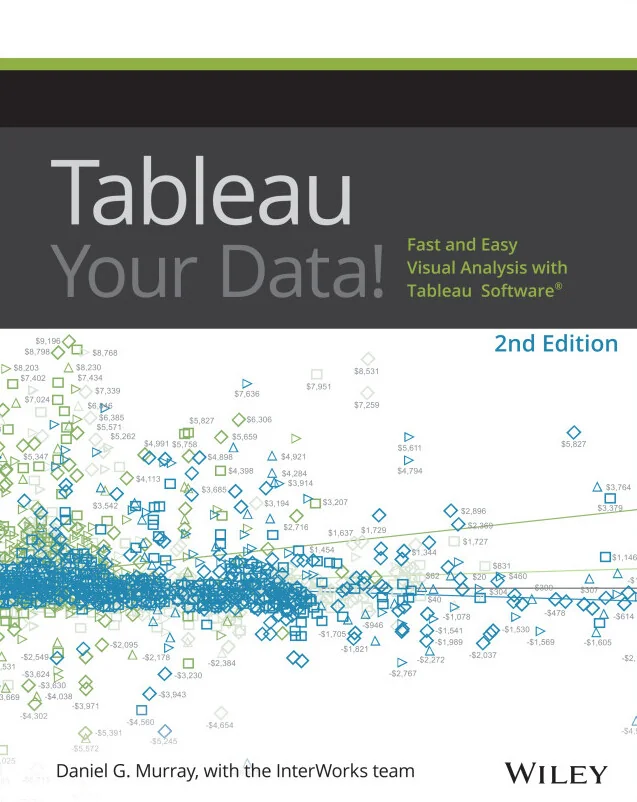
Tableau Your Data!
Fast and Easy Visual Analysis with Tableau Software®
Created by Dan Murray
Explore how to turn raw data into clear, interactive visuals using Tableau. Learn to connect different data sources, shape your information, and build calculations that reveal insights. Gain practical skills for creating dashboards that make business decisions easier and more informed.
Wiley | Oct 2026 | 736 min
What You Will Learn
You will work directly in Tableau Desktop, starting with connecting to data and moving through shaping, filtering, and building calculations. Each section focuses on hands-on steps and real-world scenarios, so you can apply what you learn right away. The focus stays on practical skills that help you build repeatable workflows.
Key Features
- Connect to and prepare data from various sources for visual analysis
- Build interactive dashboards using filters, hierarchies, and calculations
- Apply practical techniques to uncover patterns and support better business decisions
Target Audience
Ideal for business analysts, BI professionals, and data analysts who want to speed up their visual analysis. If you already know the basics of Tableau and want to deepen your skills in connecting data, building visualizations, and using advanced features like hierarchies and calculations, this course is for you.