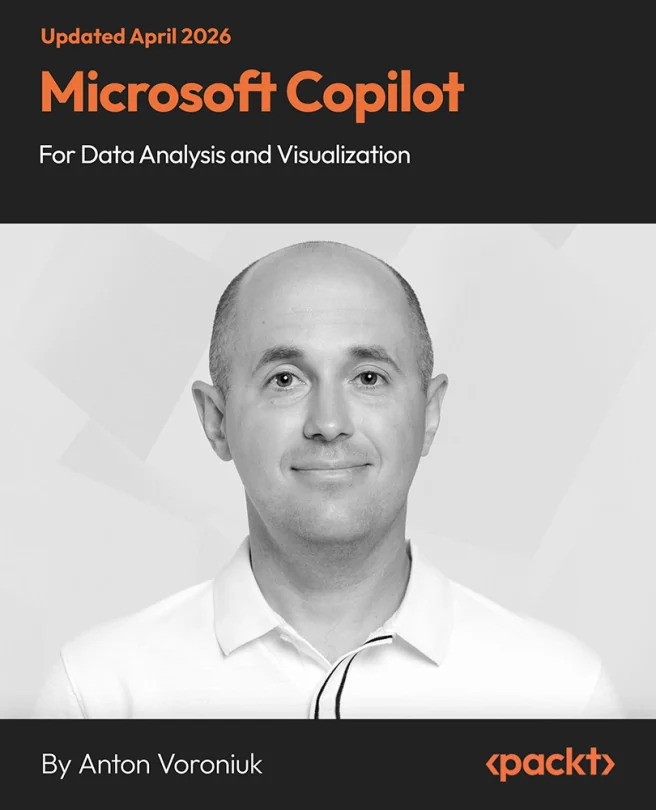
Microsoft Copilot for Data Analysis and Visualization
Master Data Analysis and Visualization Using Microsoft Copilot AI

Created by Anton Voroniuk
Unlock the power of Microsoft Copilot to streamline your data analysis and visualization tasks. Learn how to use AI to clean data, build interactive dashboards, and generate real-time business insights across Excel, Power BI, and PowerPoint. Gain practical skills to make smarter decisions and present findings effectively.
Packt | Apr 2026 | 139 min
What You Will Learn
You will work through practical exercises that show how to connect data sources and use Copilot to automate cleaning, spot trends, and create visualizations. By applying these skills in Excel, Power BI, and PowerPoint, you will learn to generate actionable insights and present them clearly to stakeholders.
Key Features
- Automate data cleaning and transformation with AI tools for faster, accurate results
- Design interactive dashboards and reports in Power BI and Excel using Copilot
- Integrate AI-driven insights into project planning and presentations for better impact
Target Audience
Ideal for data analysts, business intelligence professionals, and project managers with a basic understanding of Excel and Power BI. If you want to boost your data cleaning, reporting, and visualization skills while leveraging AI to make your workflow more efficient, you will find this course especially valuable.