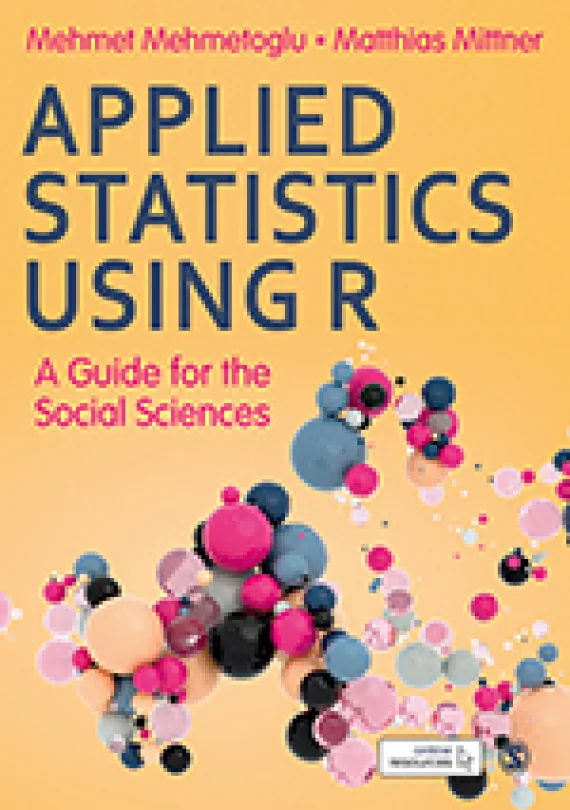
Applied Statistics Using R
A Guide for the Social Sciences
 MM
Created by Mehmet Mehmetoglu, Matthias Mittner
Explore practical statistics for the social sciences using R. Learn how to manage, analyze, and visualize data while building predictive models with real-world examples. Develop skills to interpret and communicate your findings effectively.
Sage Publishing | 472 min
What You Will Learn
You will start by getting comfortable with R and RStudio, then move on to hands-on data management and visualization. Each section introduces new statistical techniques, guiding you through practical examples and real-world datasets. You'll gradually build confidence in applying and interpreting complex analyses.
Key Features
- Import, manipulate, and manage datasets efficiently in R and RStudio
- Visualize data clearly using ggplot2 and interpret statistical results
- Build and evaluate regression, logistic, and Bayesian models for real data
Target Audience
Designed for social science professionals, students, or anyone with a basic understanding of statistics and some R experience. If you want to strengthen your data analysis, modeling, and visualization skills for research or applied projects, this course will help you take the next step in your analytical journey.