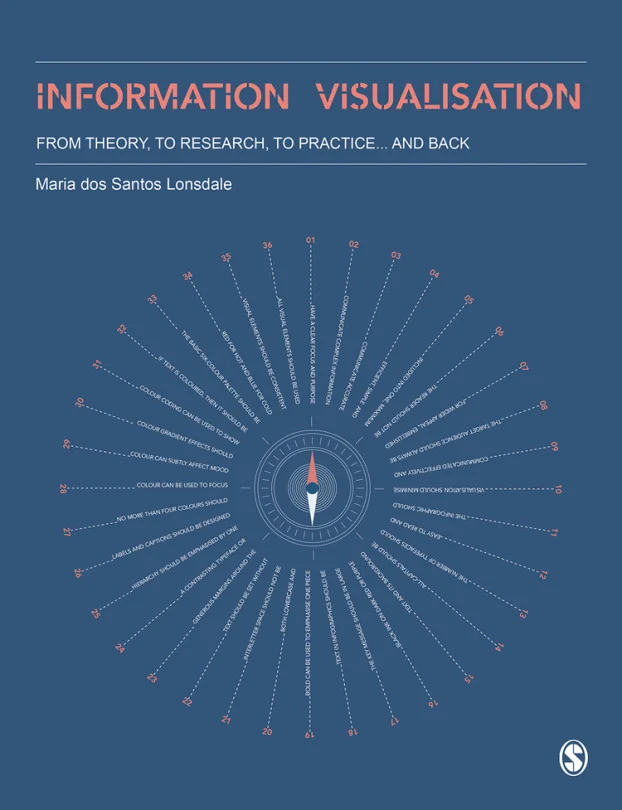
Information Visualisation
From Theory, to Research, to Practice… and Back
Created by Sage Publishing Limited, Maria dos Santos Lonsdale
Explore how to design clear and impactful data visualizations by blending theory, research, and hands-on techniques. You will learn to apply cognitive and perceptual principles to create visuals that are both user-friendly and effective in communicating information.
Sage Publishing | May 2026 | 416 min
What You Will Learn
You will move from understanding the science behind how people perceive visuals to applying proven design strategies in your own projects. Through real-world examples and user-centered research methods, you will gain practical experience and confidence in building visualizations that truly inform and engage.
Key Features
- Apply cognitive principles to make visualizations more intuitive and memorable
- Use best practices in typography, color, and layout for clear data presentation
- Analyze real-world case studies to connect theory with practical design solutions
Target Audience
Designed for professionals and students in data science, graphic design, or human-computer interaction, this course is best suited for those with some familiarity with visual design or cognitive psychology. If you want to create more effective, user-centered data visualizations, you will find practical value here.